PowerBI - Simple tips to transform your data for powerful information analysis
In my experience using Power BI, but I have come across some pitfalls with ingestion of data from relational databases. The primary issue is around trying to set up the relationships between the different tables to create a star schema to report upon. In this article, I hope to show some tricks I have learned as convention when creating / generating the source data to be ingested.
In my case, I am going to use MS SQL as the sample source; but this could just as easily be PostgreSQL, MySQL or other similar variations.
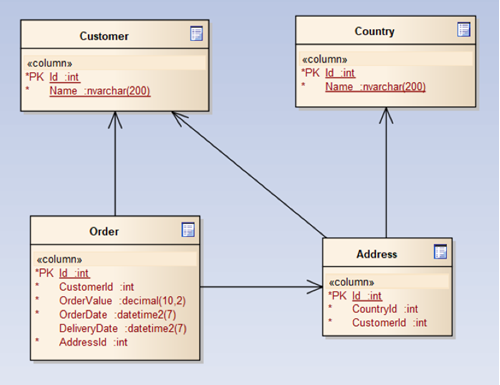
For this example I am going to use a simple web purchase scenario. The following are the tables I have defined in my much-simplified schema:
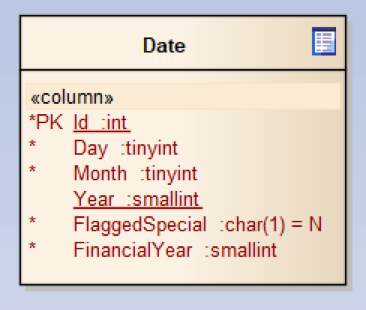
Further to this, I would also like to know if the order was taken during a specified period as it needs to be flagged for some reporting function. For this, we will create a date table which contains date specific information along with a flag that is marked against the rows for that period. We can also provide extra details about the financial year whilst about it:
NOTE: This view can also be written without the use of a table, using a view with calculated data, but this is outside the scope of this article.
In no way would this be a real-life example, but it contains the important details for our example.
The first thought would be simply to launch Power BI and import the five tables above. But almost immediately we would come across several issues:
- Providing the relationships between the tables would be difficult as Power BI tries to match on column names and types and since we’re using Id as a convention for a primary key, this would immediately create some hair-raising mapping, especially for large schemas. You could map these manually, but it is laborious and error prone.
- There is no direct link between the Date table and the various date related fields in the Order table. (Note that Power BI understands dates and can separate them into their individual components, and that is why I introduced extra variables that wouldn’t be provided by default.)
One approach would be to create a new schema for our BI purposes; and write some SQL to translate the data into the star schema using some ETL / ELT type CRON job. This is time-consuming and adds extra components to our system that we would need to manage.
A much simpler approach would be to write views over each of the above tables to provide this translation layer. Providing the data numbers are less than millions and the data is simple to transform then this can be a very cost effective/quick to market approach.
The following diagram illustrates a possible translation from the source set of tables:
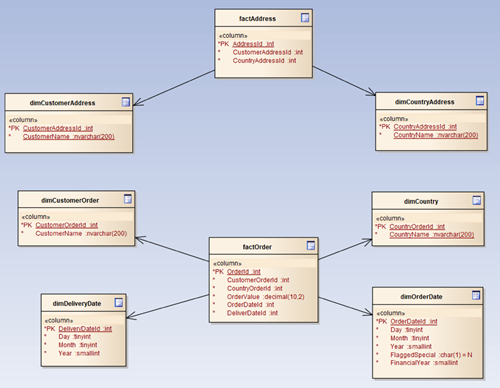
You will notice some things:
- I have prefixed each view with what it represents in our new star schema – a dimension or a fact. This helps to group the dimensions and facts naturally.
- I have explicitly renamed the primary Id’s in each table to represent the dimension they are sourced from. This is the trick to allowing Power BI to auto-map our tables.
- I have duplicated the Date table into two views, one for Order Date and one for Delivery Date. The reason for this is so that Power BI can manage the many-to-one relationships without having to reuse the same table. I have done the same for the Customer and the Country. I have also named the duplicated dimensions according to what they refer to.
- The ‘Name’ properties for both Country and Customer have been explicitly named based on what they refer to. This may be overkill; but helps identify where the property originates.
- I have removed the FlaggedSpecial and FinancialYear fields from the dimDeliveryDate view because they are not necessary in this context. (Note that in this case you could instead use Power BI’s built in date translations.)
It is worthwhile noting that using this methodology, you can also provide some filtering in the factOrder view to limit unnecessary data being loaded into Power BI, for example, remove any orders older than 2 years.
I have also found that generating the unique identity for the date dimensions as an integer that represents the date (i.e. yyyyMMdd) helps in legibility.
Next Steps are for you to take a go and see how it works for you. Good luck!
And, if you need any help or want to discuss this more then let us know. We're always happy to talk.
NOTE: Advanced PowerBI users may note that we've used prefixes for Fact and Dim(ension) - some clients prefer this as they're used to that structure but for PowerBI it's often more powerful to use the Entity name so the natural language analysis features can be used. This same approach allows for this - we just think it's easier to illustrate what we're doing with the prefixes!
About the author
Stefan Jaworski
Stefan has spent the last two decades working on high transaction and high reliability systems; ranging from insurance, banking, retail, gaming, esports and games.
He has specialities in Solution Architecture for both corporate and games clients with a keen interest in data architecture, big data and business intelligence.

